Pro-Level Observability, Logging & Best Practices in AWS API Gateway (Part - 6)
You’ve built your API, secured it, assigned a custom domain, and safely deployed it to production. Everything is running smoothly until one day, you check your dashboard and see that 15% of your users are getting 500 Internal Server Error messages.
If you don't have observability set up, you are completely blind. You won't know who is getting the error, why it is happening, or which piece of your backend code is broken.
In this final post of the series, we are going to look at how to set up professional-grade logging and monitoring for Amazon API Gateway so you can debug any multi-point failure in seconds .
1. Amazon CloudWatch: The Black Box Recorder
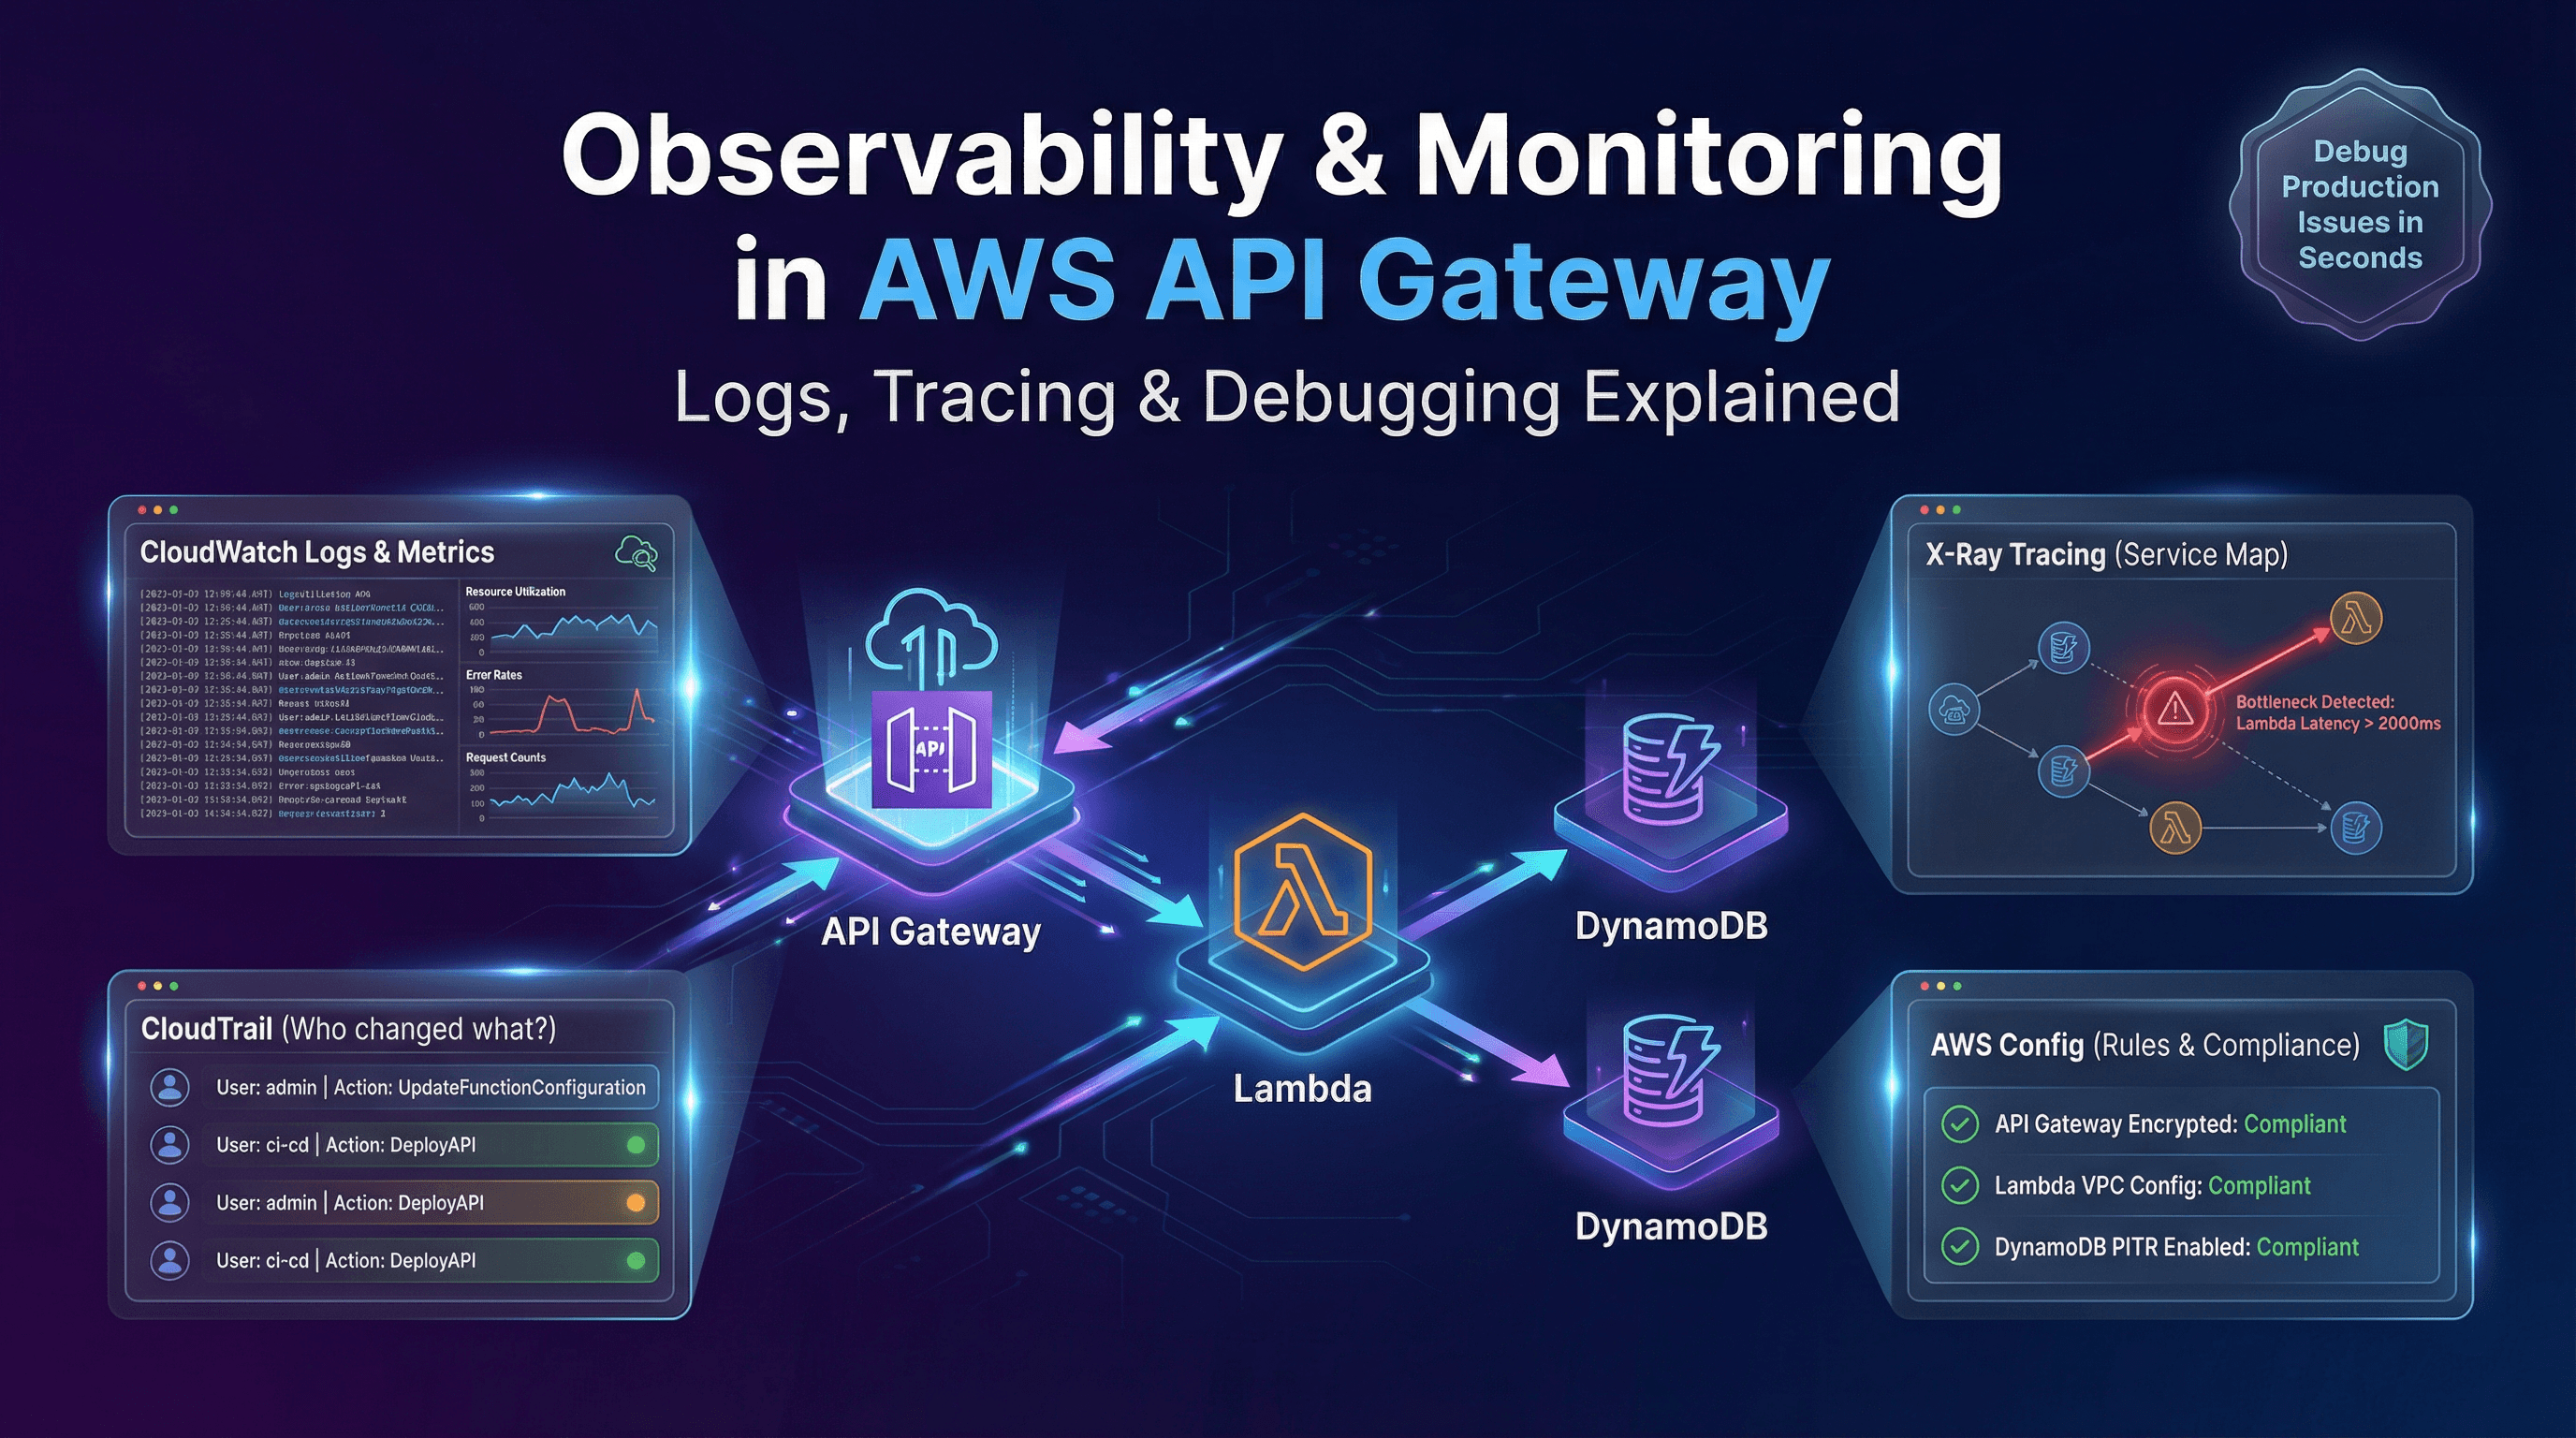
Whenever an airplane crashes, investigators look for the "black box" to hear exactly what was happening in the cockpit. In AWS, CloudWatch Logs is your black box .
When you enable CloudWatch logging for your API Gateway, it records exactly what happens during request execution and client access . There are two main types of logs you need to care about:
Execution Logs: This tells you what happened inside API Gateway. Did the Lambda Authorizer allow the request? Did the data transformation map correctly? Did the backend server take too long to respond?
Access Logs: This tells you who called the API. It records the caller's IP address, the time of the request, and the specific endpoint they tried to hit. (You can also send these access logs to Amazon Data Firehose if you want to store them in a massive data lake for long-term analysis) .
Pro Tip: Don't just look at logs; set up CloudWatch Alarms . You can tell CloudWatch to watch a specific metric—like your API's error rate. If the error rate spikes above 5% for more than 5 minutes, CloudWatch can automatically send a notification to your engineering team's Slack channel via Amazon SNS .
2. AWS X-Ray: The MRI Machine for Your Code
CloudWatch tells you that an error happened in your API Gateway. But what if the error didn't actually happen in the Gateway? What if API Gateway passed the request to a Lambda function, which passed it to a DynamoDB database, and the database was the thing that timed out?
This is where AWS X-Ray comes in .
When you enable X-Ray tracing for your REST APIs (it works for Regional, Edge-optimized, and Private endpoints), X-Ray assigns a unique "Trace ID" to a user's request the second it hits the Gateway . That Trace ID follows the request as it travels through your entire AWS backend .
Instead of reading lines of text in a log file, X-Ray gives you a visual Service Map . It draws a flowchart showing your API Gateway connecting to your Lambda function, connecting to your database.
If the database is running slowly, X-Ray will highlight that specific connection in red and tell you exactly how many milliseconds it took . It gives you an end-to-end view of the entire request so you can instantly analyze latencies and pinpoint the exact bottleneck .

3. AWS CloudTrail: The Security Camera
While CloudWatch monitors the traffic hitting your API, AWS CloudTrail monitors the developers managing your API .
CloudTrail provides a continuous record of every single action taken by a user, IAM role, or AWS service inside your account .
If someone on your team accidentally deletes a route, disables an authorizer, or pushes a bad configuration change, CloudTrail records it . You can look at the CloudTrail history to determine exactly who made the change, when it happened, and from which IP address .
4. AWS Config: The Compliance Checker
If you manage a large enterprise, you might have hundreds of APIs running at once. How do you make sure every single one of them has X-Ray tracing enabled and a Web Application Firewall (WAF) attached?
You use AWS Config .
AWS Config lets you define strict rules for your resources . You can create a rule that says: "Every API Gateway must have CloudWatch Access Logging enabled." If a developer creates a new API and forgets to turn on logging, AWS Config will immediately flag that API as "noncompliant" and can even send an alert to your security team .
Conclusion: You Are Ready for Production
Congratulations! Over the course of this 6-part series, you have gone from a complete beginner to mastering Amazon API Gateway.
You now know how to:
Choose the right architecture (Part 1 & 2)
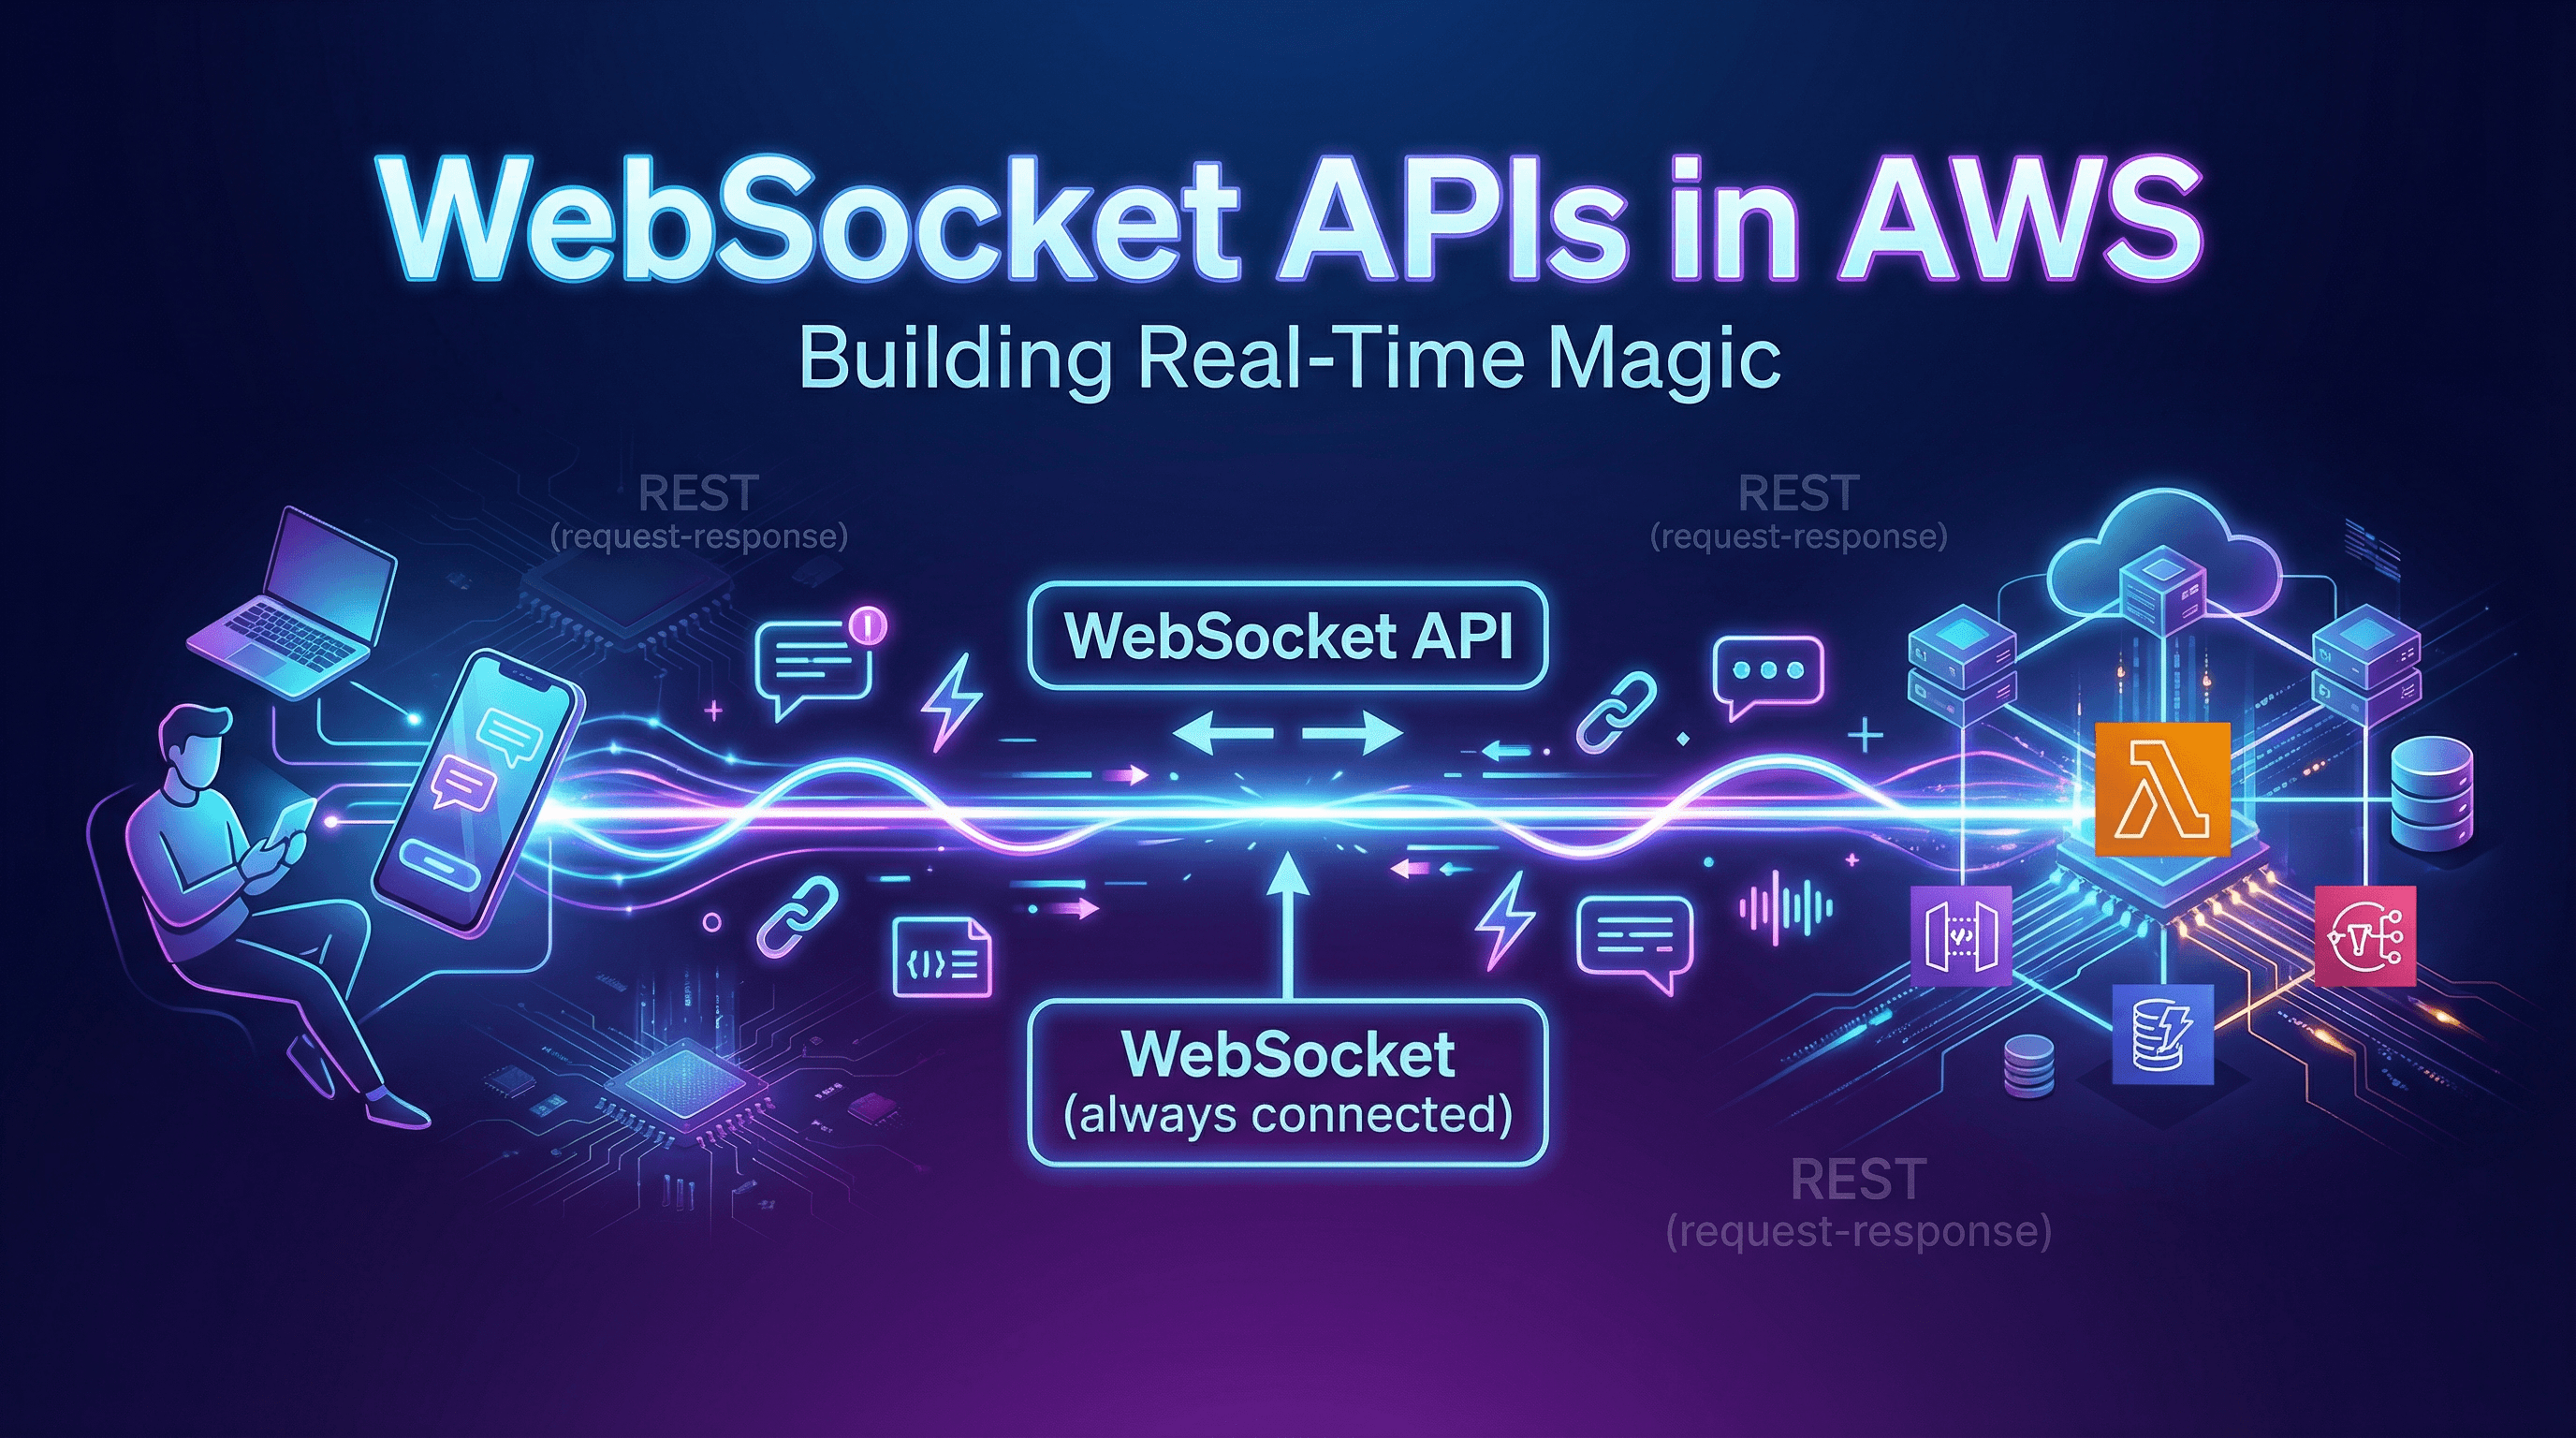
Build real-time, two-way communication systems with WebSockets (Part 3)
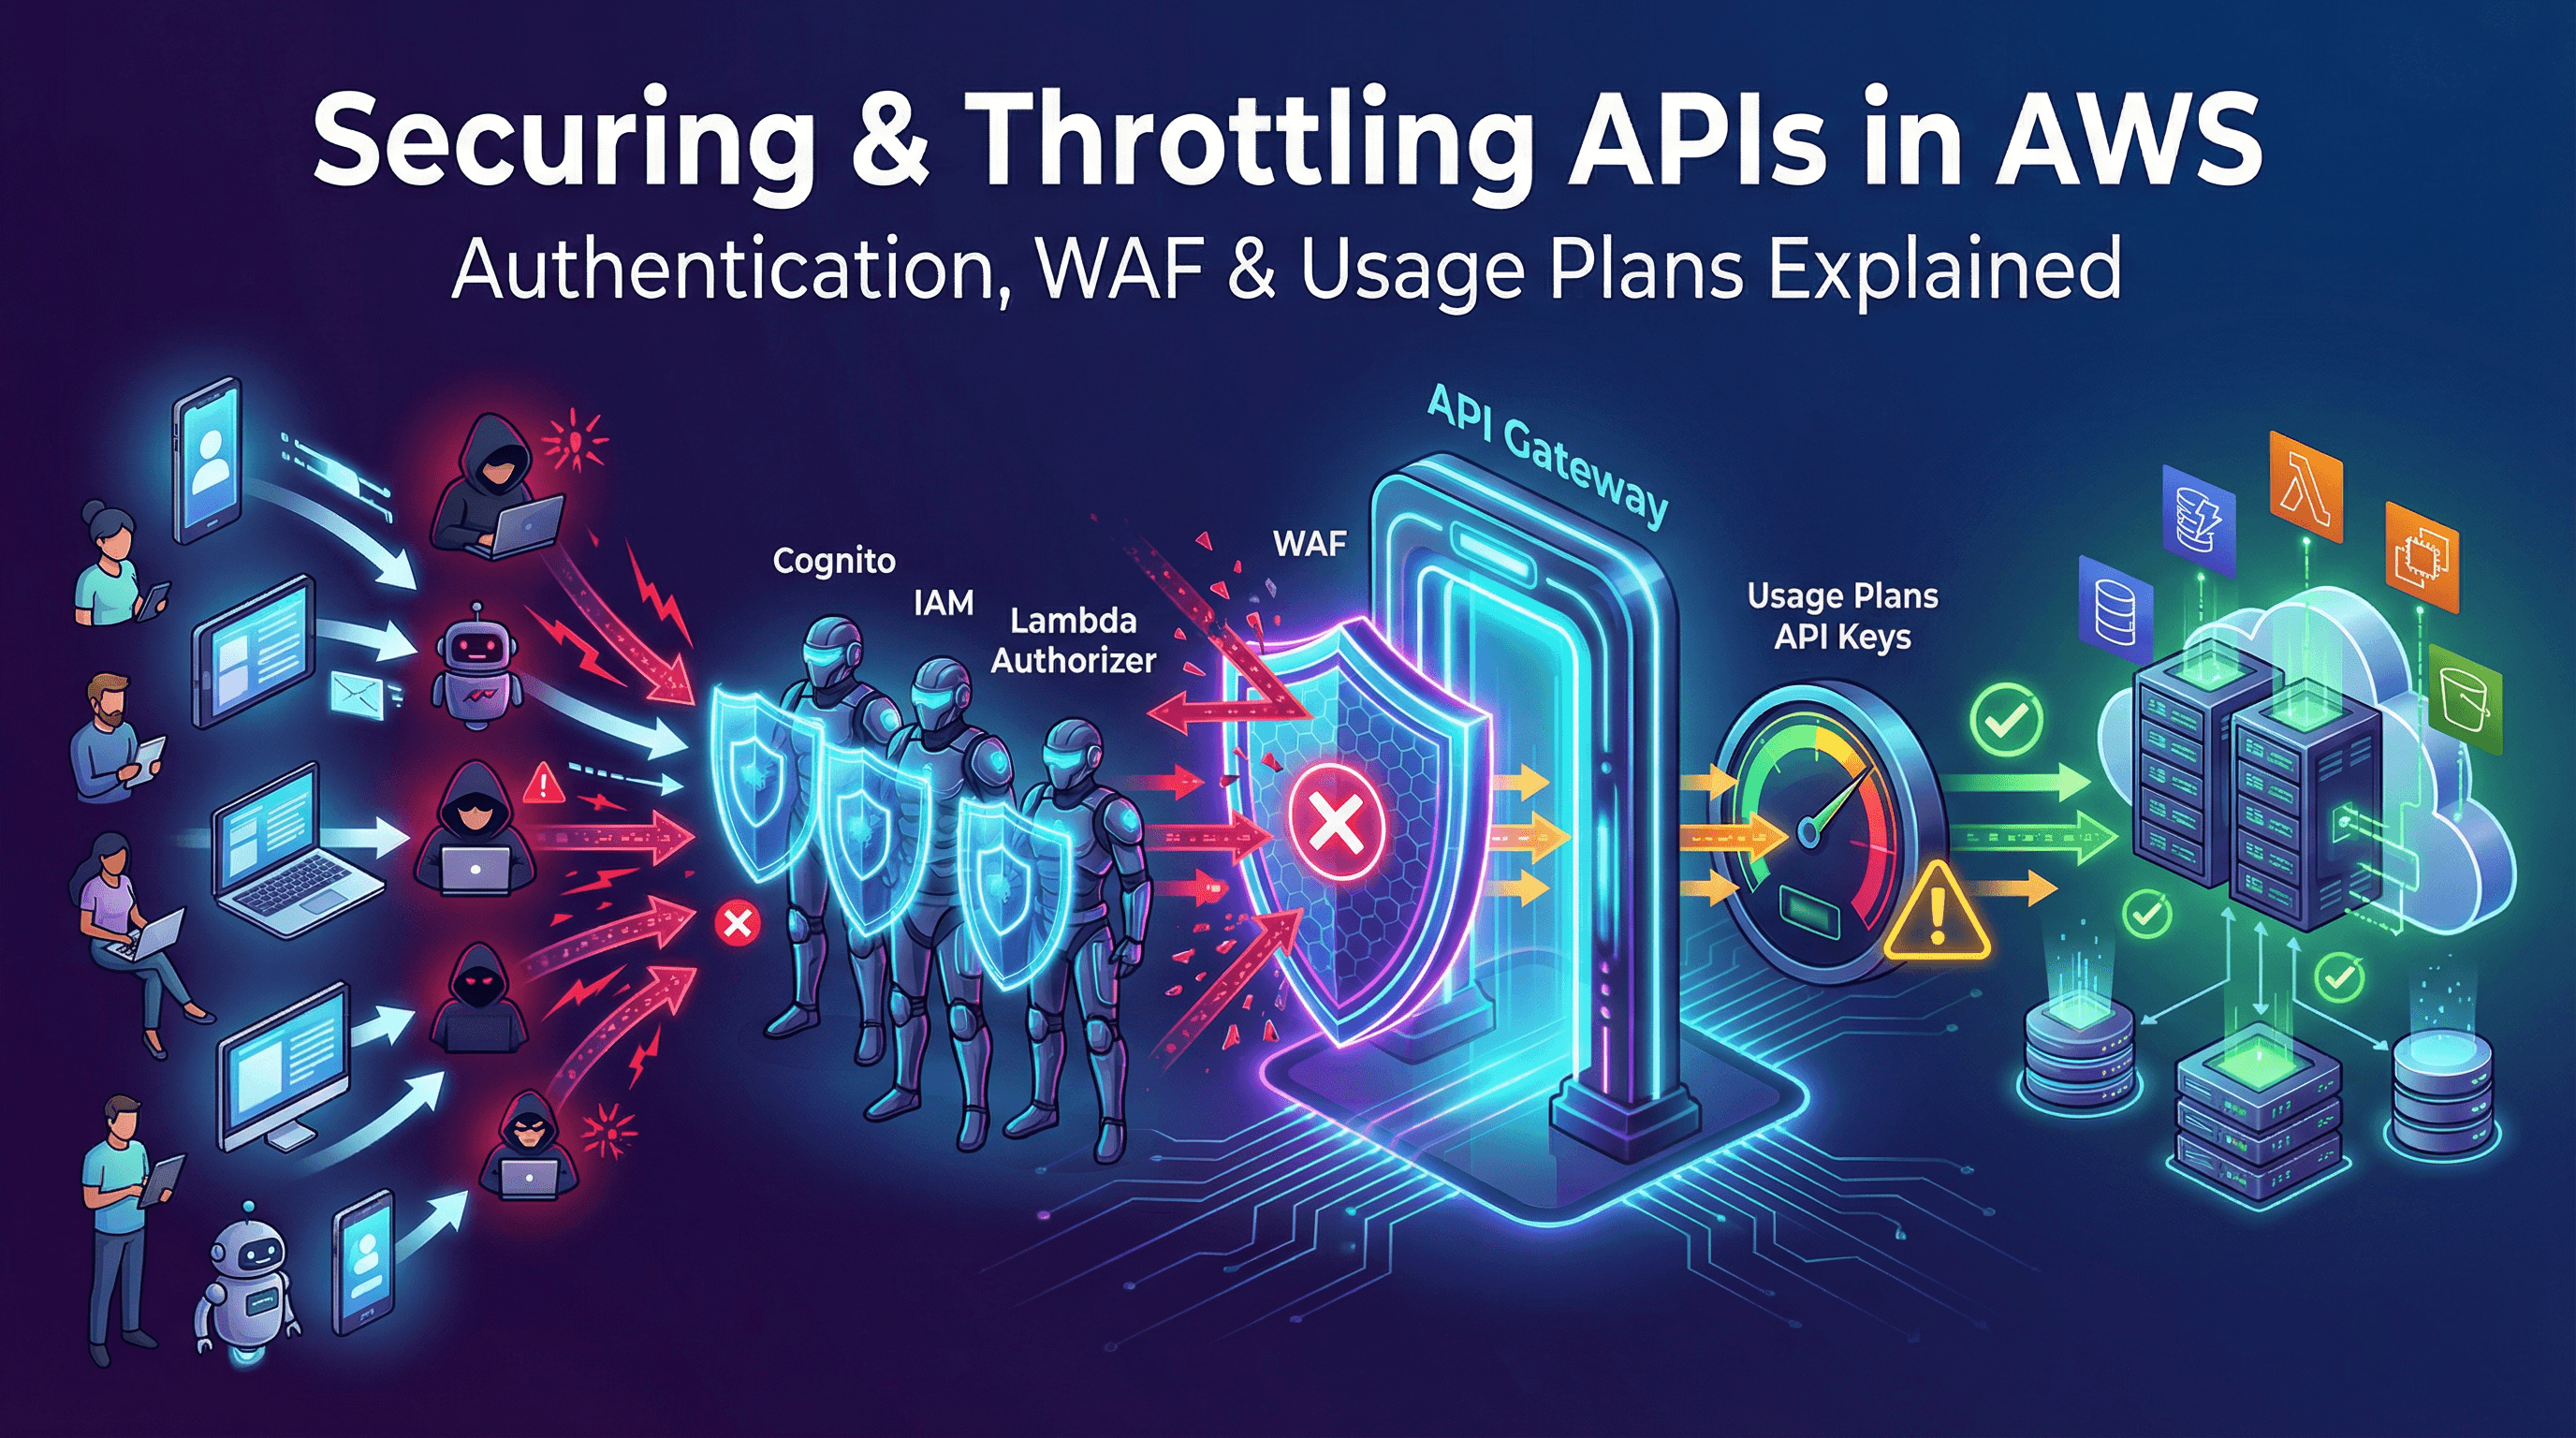
Lock down your API with Authorizers and WAF (Part 4)
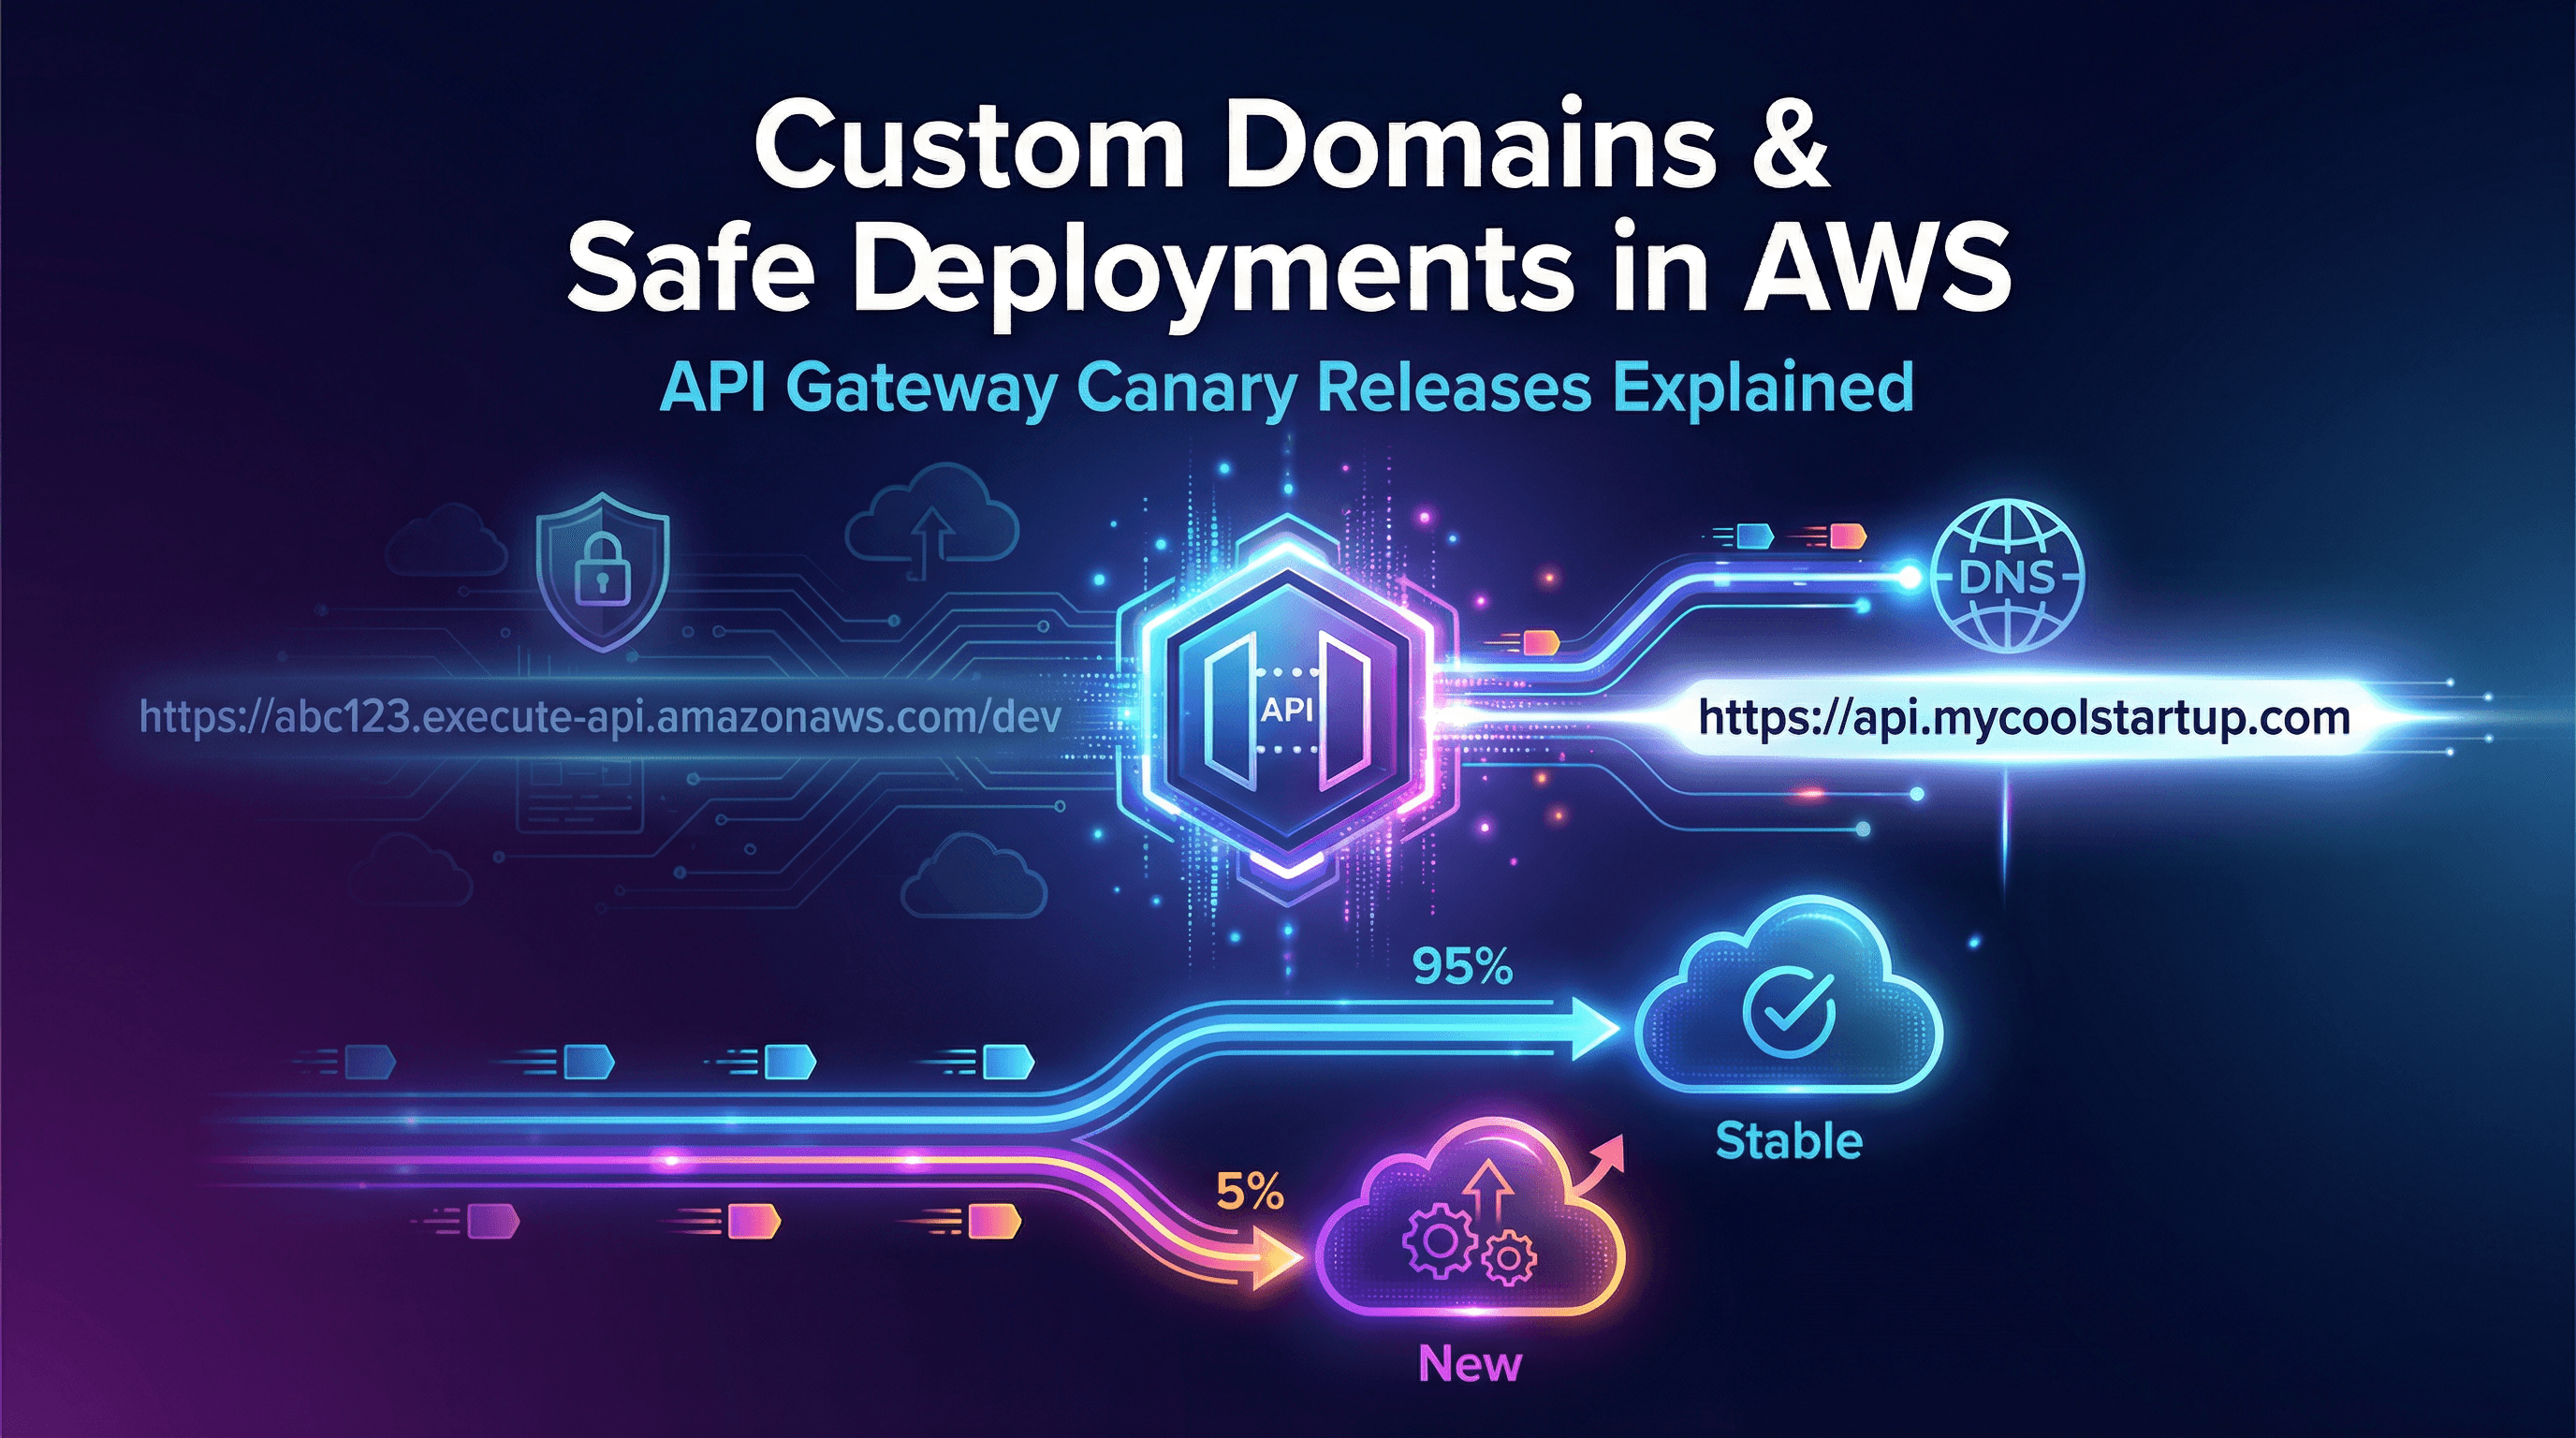
Launch safely using Custom Domains and Canary Deployments (Part 5)
Monitor, trace, and debug any failure in production (Part 6)
API Gateway is the ultimate front door for modern, serverless applications. Whether you are building a simple side project or a massive enterprise platform, you now have the tools to route your traffic quickly, securely, and reliably.
Happy building!
Here is the final roadmap block for readers who jump straight to Part 6:
| Part | Topic |
|---|---|
| Part 1 | Architecture & Core Concepts |
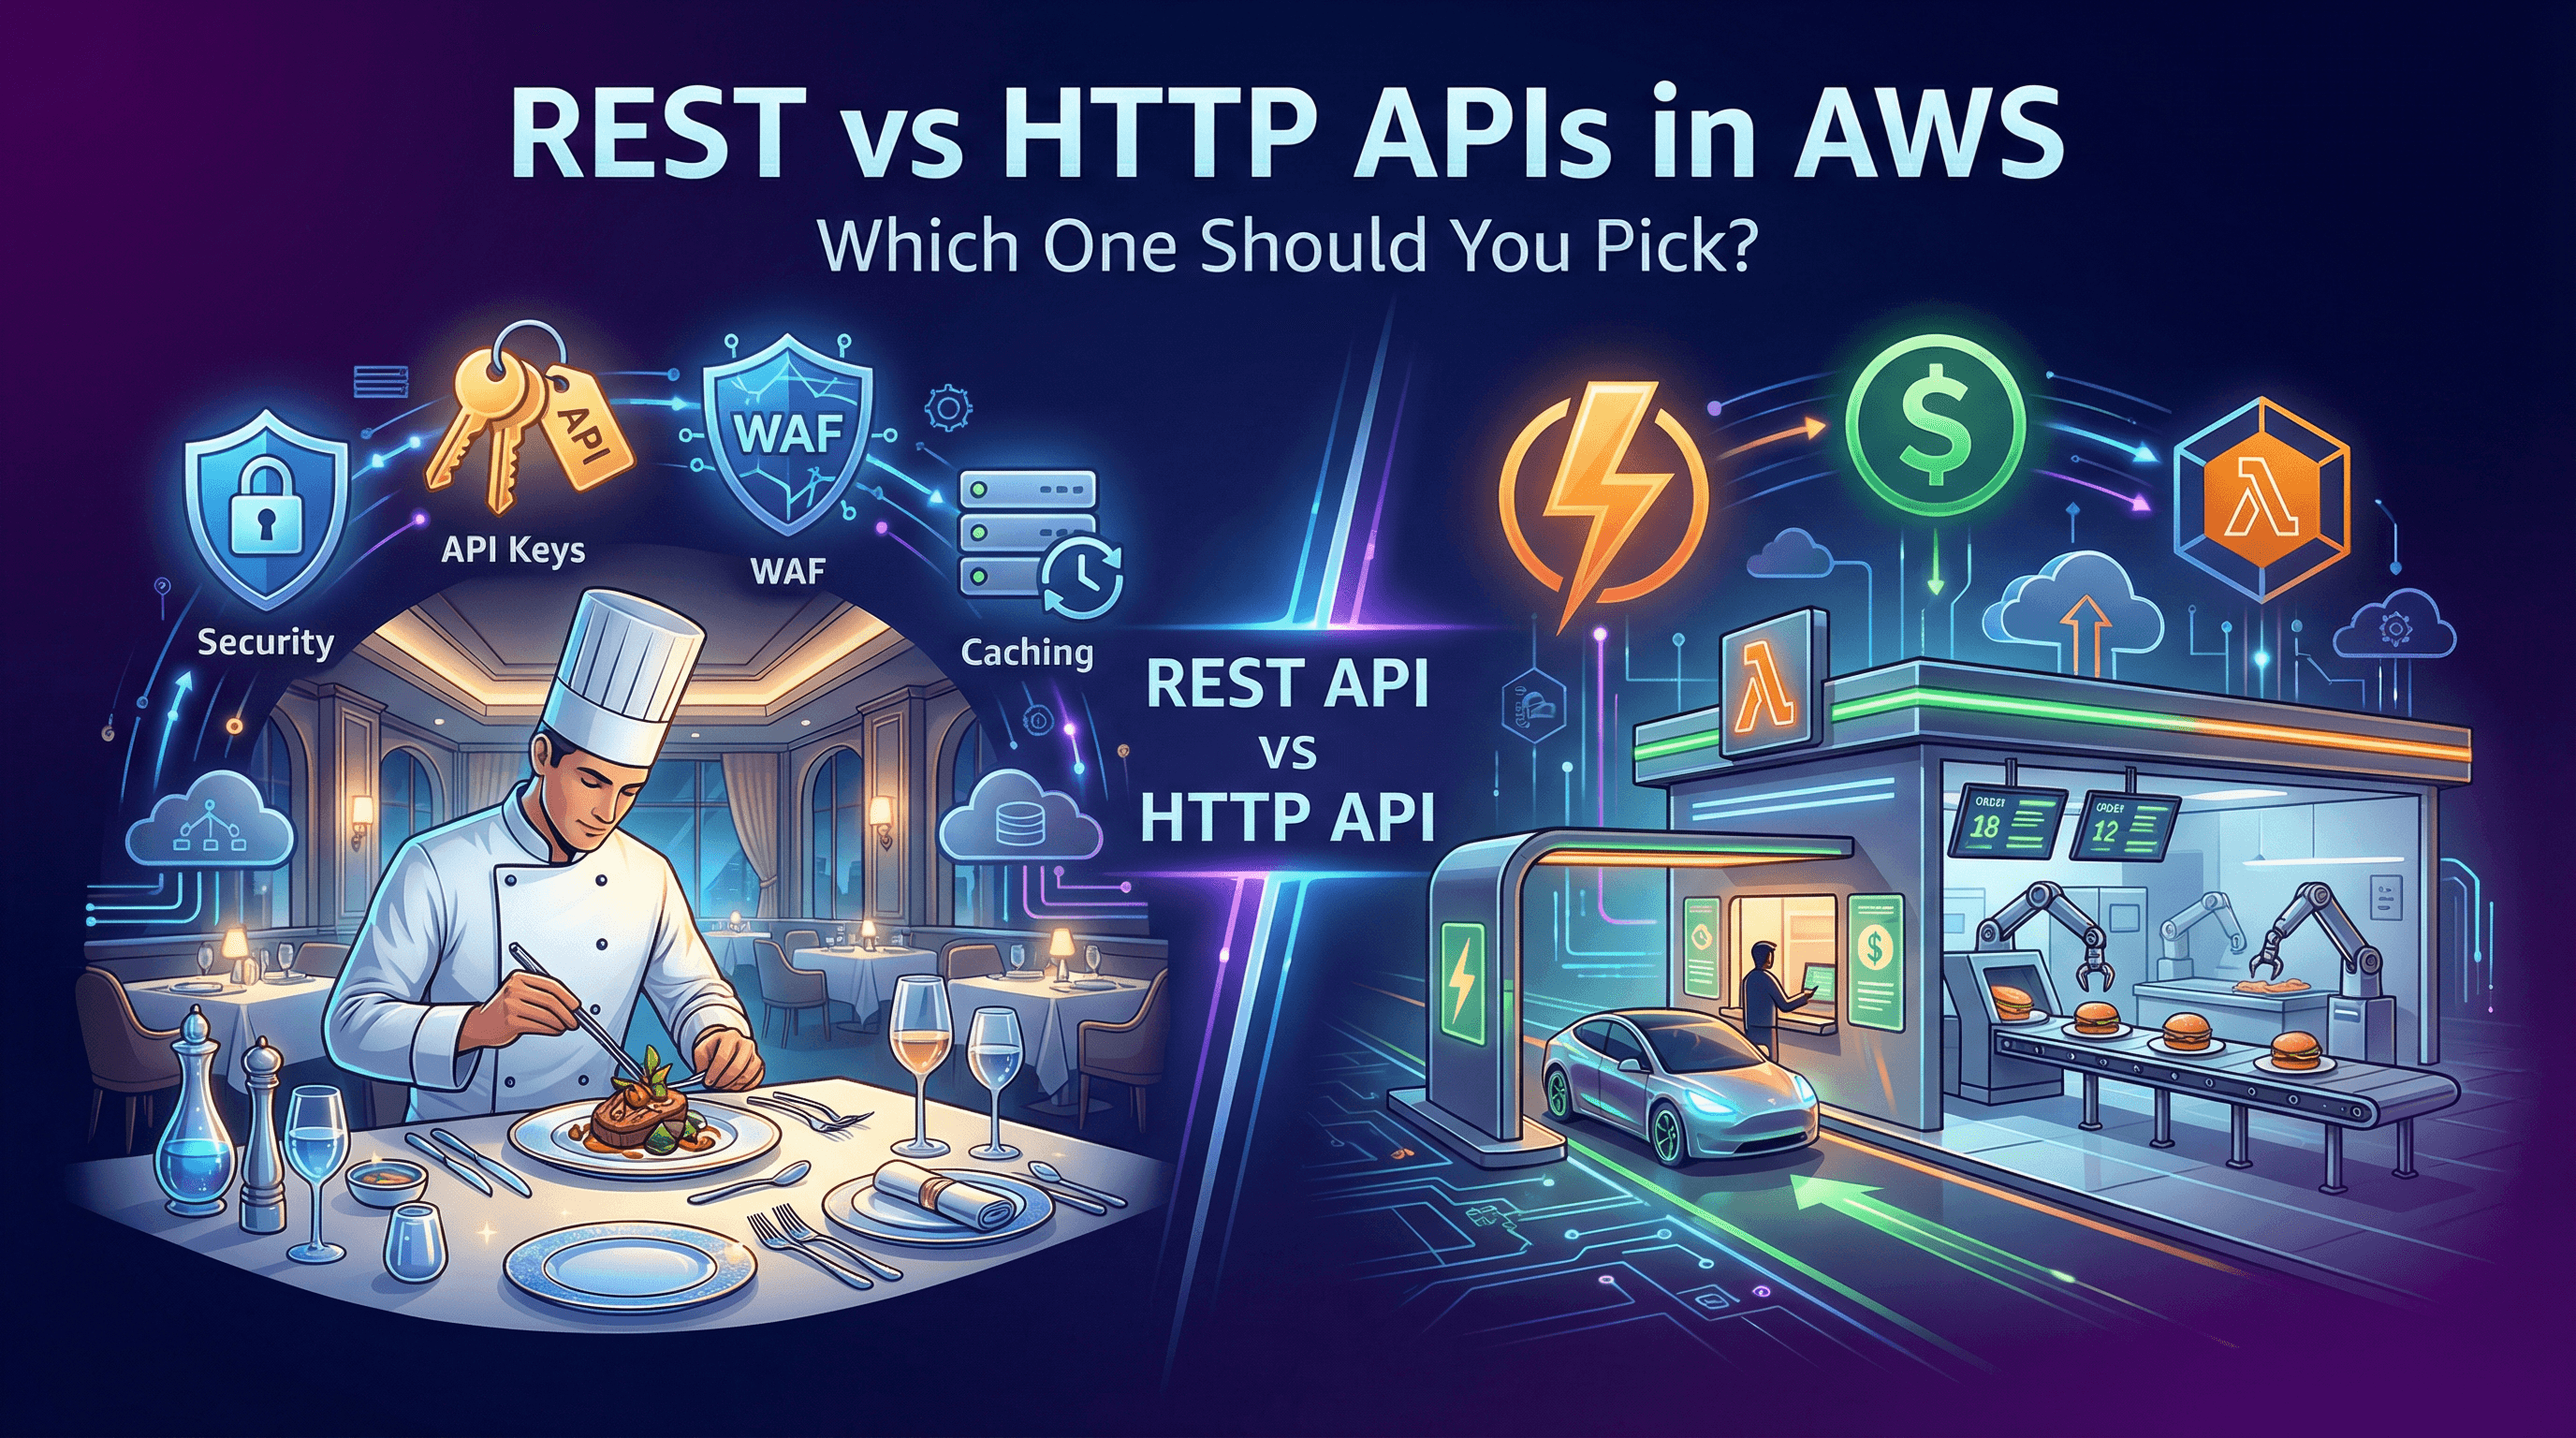
| Part 2 | REST vs HTTP APIs & Building Your First One |
| Part 3 | WebSocket APIs & Real-Time Applications |
| Part 4 | Securing & Throttling Your APIs (Auth, WAF, Quotas) |
| Part 5 | Data Mapping, Custom Domains & Deployments |
| Part 6 (This Blog) | Pro-Level Observability, Logging & Best Practices |
This completes the entire blog series based directly on the official AWS documentation. How does the final structure and flow of the series look to you?